
February 17, 2026 | by Le Due Querce editorial team
World hazelnut production is not an abstract figure to cite in a presentation. It’s the key to understanding why prices move in certain ways, why some batches are easier to find than others, and why a crisis in a specific region of the world can impact quotes that arrive in Viterbo or Piedmont.
When buying or selling hazelnuts, you always interact with a very concentrated production geography.
The numbers: who produces and how much
According to the most recent FAO data (2023), world hazelnut production in shell reached approximately 1.125 million tons. This value has grown significantly in recent decades: in 1970, global production was just over 384,000 tons. The area cultivated with hazelnuts has grown from 323,000 hectares in 1970 to over 1.078 million hectares in 2023.
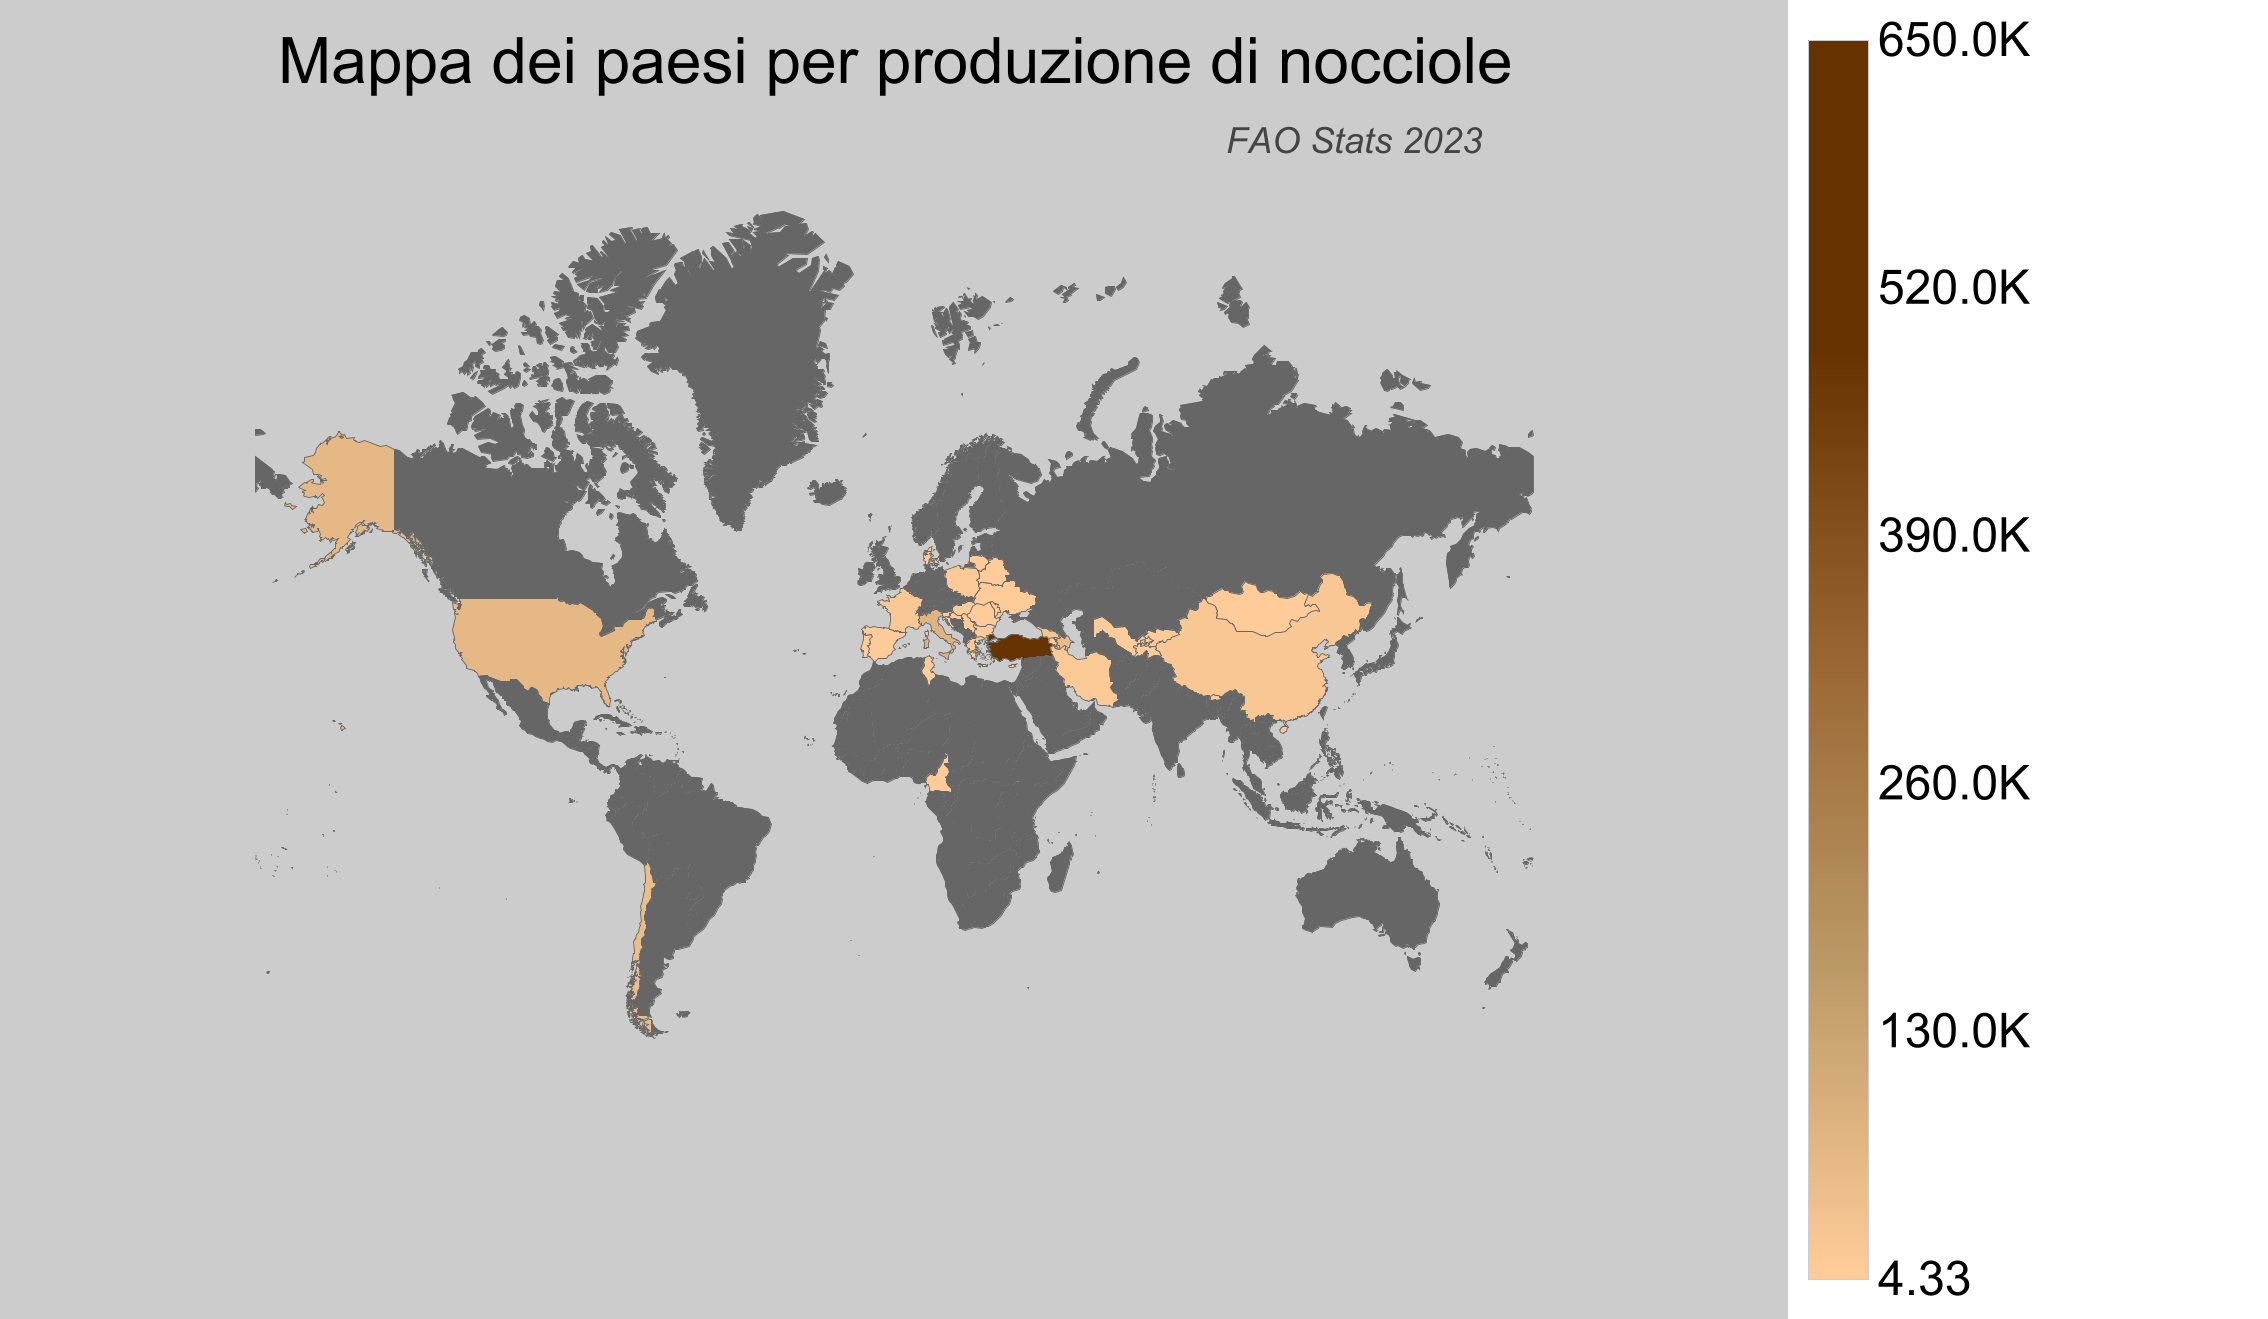
The geographical distribution of production is extremely concentrated. Five countries alone produce over 85% of the world’s hazelnuts:
Turkey: 650,000 tons (57-63% of world production). Turkish production is concentrated along the Black Sea coast, in the provinces of Ordu (31% of national production), Giresun (16%), Samsun (14%), Sakarya (13%), Düzce (11%) and Trabzon (6%). The dominant cultivars are Tombul, Palaz, Foşa and Çakıldak.
Italy: 102,740 tons (9-10% of world production). Italian production is distributed between Campania (about 40% of national production), Piedmont, Lazio and Sicily. The main cultivars include Tonda Gentile delle Langhe (Piedmont), Tonda di Giffoni (Campania), Tonda Gentile Romana and Nocchione (Lazio).
United States: 85,460 tons (7-8% of world production). 99% of American production is concentrated in Oregon, in the Willamette Valley. The most cultivated varieties are Barcelona, Ennis, Jefferson, Yamhill, Lewis, McDonald and Wepster. The United States has the highest yield per hectare in the world among major producers (about 2,500 kg/ha).
Azerbaijan: 75,409 tons (6-7% of world production). Azeri production has shown steady growth in the last decade and is characterized by remarkable year-to-year stability, with less production alternation than other countries.
Chile: 65,647 tons (5-6% of world production). Chile is the main producer in the southern hemisphere, with production concentrated in the regions of Maule, Bío-Bío, Araucanía, Los Rios and Los Lagos. The most cultivated cultivars are Chilean Barcelona and Tonda di Giffoni. Chile has seen the fastest growth among major producers: from 0.03% of world production in 2003 to 5.23% in 2022.
Other significant producers are Georgia (36,900 tons), Spain (variable production between 15,000 and 25,000 tons), France, Iran and some countries of the former Soviet Union, but none of these have significant weight on the international market.
Why geographic concentration is relevant
The strong production concentration in few countries has concrete consequences on the global market. The most evident is that any climatic or phytosanitary event affecting Turkey immediately impacts world prices. Turkey is not only the first producer: it is also the first exporter, covering over 80% of international hazelnut trade.
Italy, despite being the second world producer, is also one of the main importers. Italian domestic consumption, driven by the confectionery and processing industry, far exceeds national production. According to FAO sources, Italy consumes about 0.52 kg of shelled hazelnuts per capita per year, a figure surpassed only by Switzerland (1.7 kg per capita) and Austria (1.3 kg per capita).
The United States, on the contrary, consumes most of their production internally and have become net exporters only in recent years. Their very high yield per hectare (almost double that of Turkey) makes them competitive in the premium market, especially for in-shell product intended for direct consumption.
Chile, finally, has the advantage of counter-seasonal production compared to the northern hemisphere. It harvests between March and April, when European and North American warehouses are depleting stocks from the previous season. This allows it to access a market window with structurally higher prices.
What determines price fluctuations
Hazelnut prices are not formed only based on global supply-demand ratio. Three structural factors weigh decisively.
The first is production alternation. The hazelnut tree has a natural tendency to alternate bearing: a year of abundant production is often followed by a year of scarce production. This phenomenon is particularly marked in Italy and less evident in Azerbaijan, where more stable climatic conditions attenuate the problem. The consequence is that the market moves on biennial cycles, with prices oscillating significantly from one season to another.
The second factor is climatic variability. Late frosts, heat waves during flowering, summer drought or excess rain during harvest can drastically reduce yields. In Turkey, where production is concentrated on a relatively narrow coastal strip, an adverse climatic event can simultaneously influence more than half of world production. This is exactly what happened in 2025, when frosts and drought reduced Turkish production from 600-800,000 tons to 400-500,000 tons.
The third factor is the export market structure. Turkey mainly exports shelled product (kernel) intended for industry. Italy exports high-quality product, often with protected designations (Piedmont IGP, Giffoni IGP, Romana DOP), at premium prices. The United States exports both in-shell and shelled, but with smaller quotas than Turkey. Chile competes in the medium-high segment with counter-seasonal product. Each segment responds to different price logics and different buyers.
How to read the market as a producer or buyer
For an Italian producer, understanding world production geography means understanding the context in which their harvest is placed. If Turkey has a year of scarce production, demand shifts to other suppliers and prices in Italy tend to rise even for non-DOP products. If Turkey has an exceptional year, downward pressure on prices is strong, and only products with certification or distinctive organoleptic characteristics manage to maintain acceptable margins.
For a buyer, knowing volumes and harvest times in different countries allows for more rational supply planning. Knowing that Chile harvests in March means knowing that between April and June the market will have availability of fresh counter-seasonal product. Knowing that Azerbaijan has stable production means knowing that it represents a reliable source for medium-large volumes, even if with fewer varieties than the Italian offer.
In summary, the geography of world hazelnut production is not an academic detail. It’s a concrete tool for interpreting quotations, evaluating supply risks and positioning your product or purchasing strategy more consciously.
To understand how production data translates into concrete price dynamics in the Italian market, read Hazelnut market and prices: what they really depend on (and how to ask for comparable quotes).
To understand the climatic context that characterized recent Italian production, consult For hazelnuts high prices and inconsistent harvest: “Climate impacts 70%”.
To orient yourself among the different Italian designations in a global context, see Hazelnuts: disambiguation of names for orders and specifications (Piedmont, Giffoni, Romana).